View, analyse and export your data
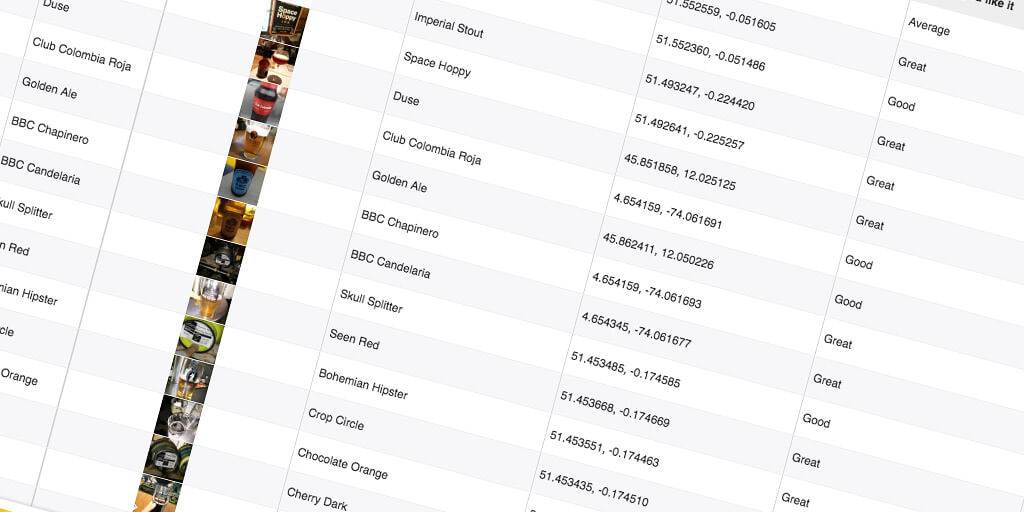
1. View collected data on a table
Data collected from multiple devices is aggregated on the server.
View your data collection as a table.
Edit each entry or just delete the ones you do not want.
Add new entry directly via the web interface.
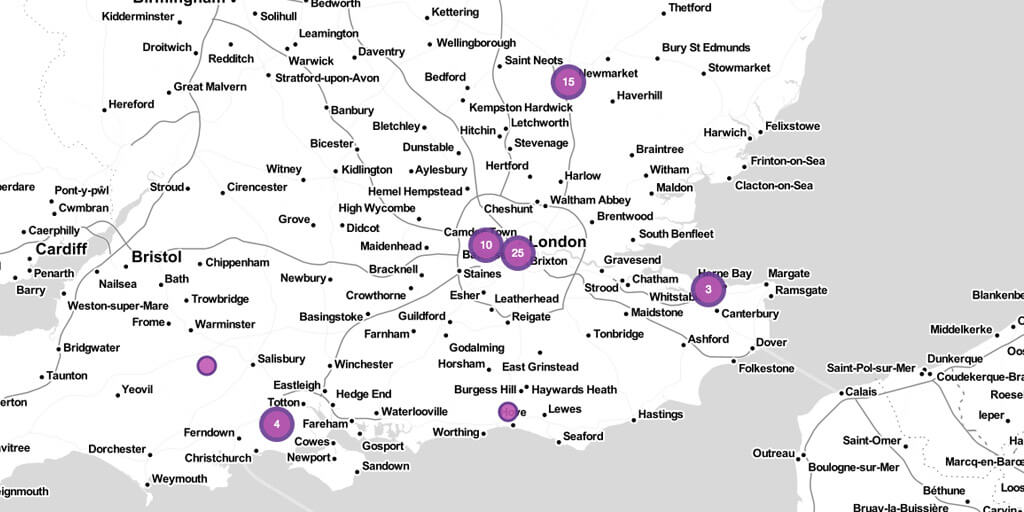
2. View data collected on a map
If your project contains locations, data can be viewed on a map.
Click on a single marker to view details about a single entry.
Select a multiple choice question to view distribution as pie charts.
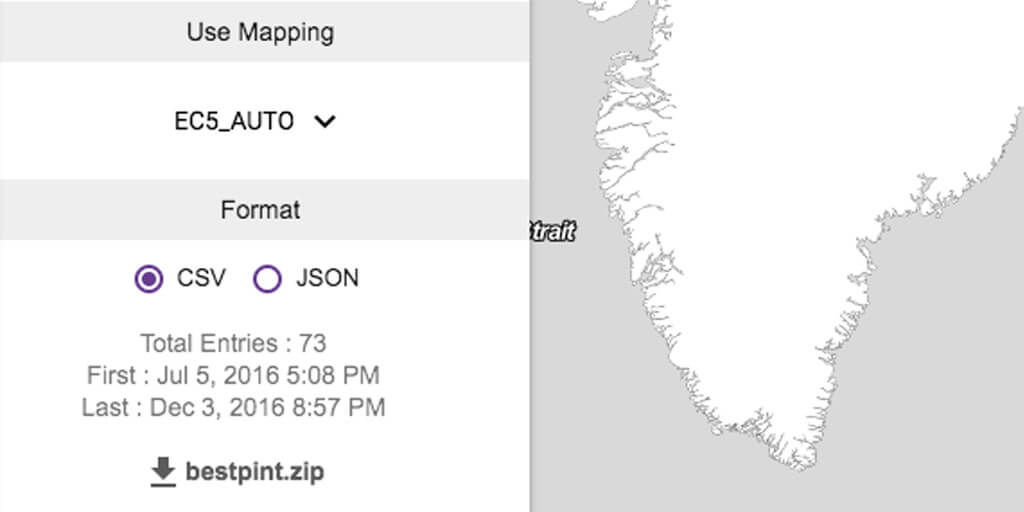
3. Download your data
Data can be easily downloaded in both JSON and CSV formats.
For advanced users, select a data mapping to use for the download.